 Past performance is not indicative of future results. All historical data, including but not limited to returns, volatility, and other performance metrics, should not be construed as a guarantee of future performance
BTCUSD on a 4-Hour Timeframe
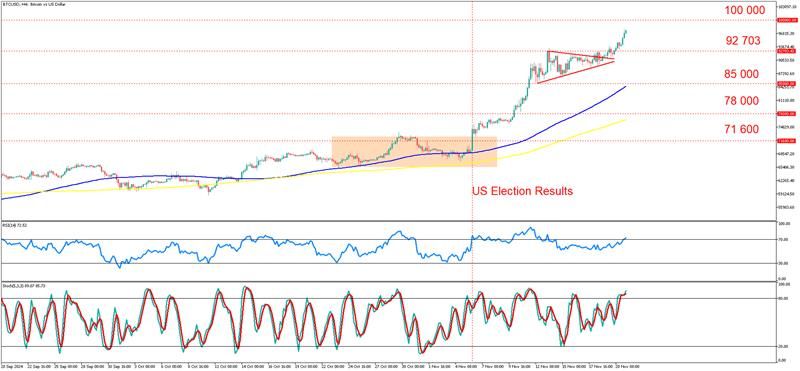
BTCUSD on a 4-hour timeframe shows a notable bullish breakout following a period of consolidation. Historically, Bitcoin has demonstrated resilience at key support levels, most recently at $71,600. The price action since late September indicates an upward trend supported by rising institutional interest, with the market showing strong bullish momentum as it moved past $78,000 and consolidated briefly before its current breakout. The chart highlights the influence of major news events, such as the U.S. election results, which appear to have bolstered confidence in the cryptocurrency market.
The recent price action saw Bitcoin forming a triangle pattern above $85,000, which broke to the upside, confirming bullish continuation. This move propelled Bitcoin towards its next significant resistance at $92,703, a key psychological and technical level. The RSI has entered overbought territory at 72.5, while the Stochastic oscillator indicates strong bullish momentum but is also approaching overbought levels. Both suggest a potential pullback or consolidation in the short term.
Technical indicators reinforce the bullish outlook. The 50-period moving average (blue) and the 200-period moving average (yellow) are sloping upwards, with the price remaining well above both, indicating strong underlying trend support. Additionally, Bitcoin's price action aligns with a surge in trading volumes, affirming the strength of the recent breakout.
The primary scenario suggests Bitcoin is on course to test the $100,000 psychological resistance, with intermediate levels like $92,703 likely to act as staging points for further upward movement. Continuation above $100,000 would signal the potential for Bitcoin to enter uncharted territory, attracting further speculative and institutional interest.
An alternative scenario envisions a retracement, particularly given overbought conditions on key momentum indicators. A pullback could see Bitcoin testing $85,000 or even $78,000 as support before resuming its upward trajectory. Failure to hold these levels might indicate a deeper correction, bringing $71,600 back into focus.
Investors should remain cautious of potential profit-taking near all-time highs and monitor developments such as inflation and global economic uncertainty. While the bullish narrative remains dominant, heightened volatility and regulatory developments could create short-term disruptions.
Summary:
- BTCUSD breaks $85K resistance, signaling strong bullish momentum.
- Overbought RSI and Stochastic suggest short-term consolidation risks.
- High trading volumes and bullish breakout target $100K psychological level.
- Key support at $85K, resistance levels at $92K and $100K.
- Sustained bullish trend could test uncharted territory above $100K.

